Group Decision Making:
How to Make a Decision

Decision making is the most important thing we do in life. We decide on whom to marry, what college to attend, what job offer to accept, what city to live in, what stocks to invest in, what service our corporation should sell, how best to advertise, how to resolve a conflict and so on. A complex decision involves many factors all of which play a role in bringing that decision about. But not all the factors are equally important. Our challenge is to find a way to determine their priorities so we can mix them in the right proportion to make a successful decision. How do we do that?
Decisions are made from well thought out judgments about all kinds of influence. To develop well thought out judgments we need to break a decision problem down into smaller judgments about the criteria and alternatives of that decision. Then we must represent these judgments with numbers, derive priorities from the numbers and finally synthesize the priorities to get an overall outcome for the alternatives. Hierarchic and network structures are the only ways we have to break a decision down in this way. In this chapter we develop and illustrate with an example some of the details of setting priorities and synthesizing them to make a decision.
Thus to make a decision we need to develop priorities of importance of the different factors in that decision by comparing them as to how strongly they influence the fulfillment of our goal. The most accurate way to do comparisons is to make them in pairs. For each pair we identify the less important factor and estimate how strongly (how many times more) the other factor is more important or more preferred with respect to the goal. Similarly, for each factor we need to determine which of two alternatives is more preferred than the other and how strongly it is preferred. The final overall decision reflects a combination of all the priorities of the factors and of the alternatives with respect to each of the factors. Later we will show how to combine their separate judgments into a single representative judgment.
It is rare that the knowledge and judgment of one person is adequate to make a decision about the welfare and quality of life for a group. To broaden understanding and improve the accuracy of the judgments and the quality of the outcome, participation and debate are needed by all the people involved. Here two aspects of group decision making have to be considered to capture the diversity of knowledge, understanding, and specialized knowledge and experience within the group. The first is a rather minor complication, namely, the discussion and exchange within the group to reach some kind of consensus on the given problem. The second is of much greater difficulty. The holistic nature of the given problem necessitates that it be divided into smaller subject-matter areas within which different groups of experts determine how each area affects the total problem. A large and complex problem can rarely be decomposed simply into a number of smaller problems whose solutions can be combined into an overall answer. Peter Senge, in his award winning book The Fifth Discipline: The Art and Practice of the Learning Organization used the phrase “Dividing an elephant in half does not produce two small elephants” as one of the laws in systems thinking [1]. Review and iteration are needed to improve the outcome of a strategic decision. We need a process that is simple enough to do all the above credibly and without the assistance of an expert in the method invited in to help. In sum, a decision-making approach should have the following characteristics:
We must answer such questions as the following: Which objectives are more important and how important are they? What is likely to be gained? What are the pains and costs involved? What are the risks? After we get the answer the next question would be: What should we plan for and how do we bring it about? These questions demand a multicriteria logic. It has been demonstrated over and over by practitioners who use the process discussed in this chapter, that multicriteria logic gives different and often better answers to these questions than ordinary logic, and does it efficiently.
To make a decision one needs various kinds of knowledge, information, and technical data:
The set of potential outcomes and the alternatives from which to choose are the essence of decision making. In laying out the framework for making a decision, one needs to sort the elements into groups or clusters that have similar influences or effects. One must also arrange them in some rational order to trace the outcome of these influences. Briefly, we see decision making as a process that involves the following steps:
The AHP [2] is about breaking a problem down and then aggregating the solutions of all the sub-problems to arrive at a conclusion. It facilitates decision making by organizing perceptions, feelings, judgments, and memories into a framework that exhibits the forces that influence a decision. In the simple and most common case, the forces are arranged from the more general and less controllable to the more specific and controllable.
What we have described so far may be called a rational approach to making decisions. By rational we mean:
Perhaps the most creative part of decision making that has a significant effect on the outcome is modeling the problem. In the AHP, a problem is structured as a hierarchy. It is then followed by a process of prioritization, which we describe in detail later. Prioritization involves eliciting judgments in response to questions about the dominance of one element over another when compared with respect to a property. The basic principle to follow in creating this structure is always to see if one can answer the following question: Can I compare the elements on a lower level using some or all of the elements on the next higher level as criteria or attributes of the lower level elements?
A useful way to proceed in structuring a decision is to come down from the goal as far as one can by decomposing it into the most general and most easily controlled factors. One can then go up from the alternatives beginning with the simplest subcriteria that they must satisfy and aggregating the subcriteria into generic higher level criteria until the levels of the two processes are linked in such a way as to make comparison possible. In Chapter 4 we give a variety of examples of hierarchies and networks and discuss the process of structuring decisions in greater detail. In addition, there are two important references with hundreds of examples: The Hierarchon for hierarchic models [3] and the Encyclicon for network models [4].
Westmoreland County Hospital in Western Pennsylvania, like hospitals in many other counties around the nation, has been concerned with the costs of the facilities and manpower involved in taking care of terminally ill patients. Normally these patients do not need as much medical attention as do other patients. Those who best utilize the limited resources in a hospital are patients who require the medical attention of its specialists and advanced technology equipment, whose utilization depends on the demand of patients admitted into the hospital. The terminally ill need medical attention only episodically. Most of the time such patients need psychological support. Such support is best given by the patient's family, whose members are able to supply the love and care the patients most need. For the mental health of the patient, home therapy is a benefit. Most patients need the help of medical professionals only during a crisis. Some will also need equipment and surgery.
The planning association of the hospital wanted to develop alternatives and to choose the best one considering various criteria from the standpoint of the patient, the hospital, the community, and society at large.
In this problem, we need to consider the costs and benefits of the decision. Cost includes economic costs and all sorts of intangibles, such as inconvenience and pain. Such disbenefits are not directly related to benefits as their mathematical inverses, because patients infinitely prefer the benefits of good health to these intangible disbenefits. To study the problem, one needs to deal with benefits and with costs separately.
To keep matters simple we give an example of a decision made by considering benefits and costs only. No opportunities and risks were included as one usually must do in a more complex decision. The first author met with representatives of the planning association for several hours to decide on the best alternative. To make a decision by considering benefits and costs, one must first answer the question: In this problem, do the benefits justify the costs? If they do, then either the benefits are so much more important than the costs that the decision is based simply on benefits, or the two are so close in value that both the benefits and the costs should be considered. Then we use two hierarchies for the purpose and make the choice by forming the ratio from them of the (benefits priority/cost priority) for each alternative. One asks which is most beneficial in the benefits hierarchy of Figure 2.1 and which is most costly in the costs hierarchy of Figure 2.2.
If the benefits do not justify the costs, the costs alone determine the best alternative, that which is the least costly. In this example, we decided
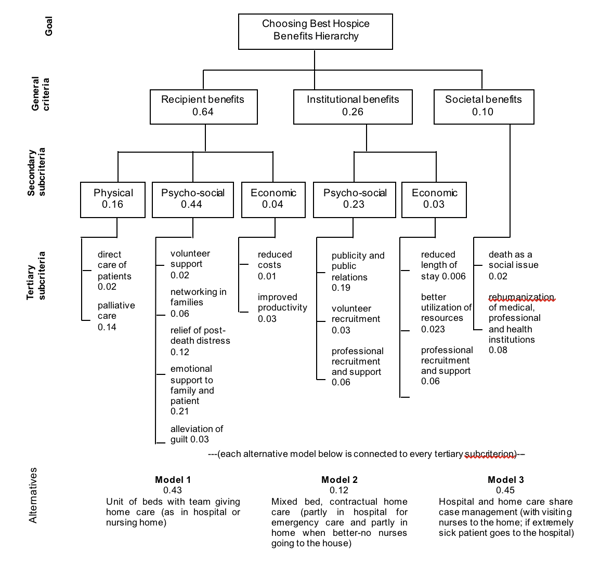
Figure 2.1 Benefits Hierarchy to Choose the Best Hospice Plan
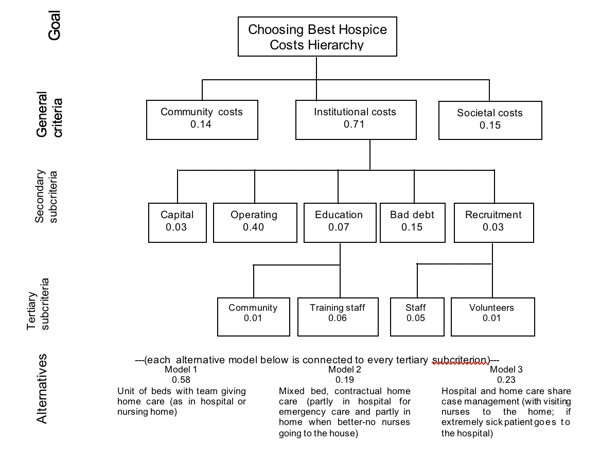
Figure 2.2 Costs Hierarchy to Choose the Best Hospice Plan
that both benefits and costs had to be considered in separate hierarchies. In a risk problem, a third hierarchy is used to determine the most desired alternative with respect to all three: benefits, costs, and risks. In this problem, we assumed risk to be the same for all contingencies. Whereas for most decisions one uses only a single hierarchy, we constructed two hierarchies for the hospice problem, one for benefits or gains (which model of hospice care yields the greater benefit) and one for costs or pains (which model costs more).
The planning association thought the concepts of benefits and costs were too general to enable it to make a decision. Thus, the planners further subdivided each (benefits and costs) into detailed subcriteria to enable the group to develop alternatives and to evaluate the finer distinctions the members perceived between the three alternatives. The alternatives were to care for terminally ill patients at the hospital, at home, or partly at the hospital and partly at home.
For each of the two hierarchies, benefits and costs, the goal clearly had to be choosing the best hospice. We placed this goal at the top of each hierarchy. Then the group discussed and identified overall criteria for each hierarchy; these criteria need not be the same for the benefits as for the costs.
The two hierarchies are fairly clear and straightforward in their description. They descend from the more general criteria in the second level to secondary subcriteria in the third level and then to tertiary subcriteria in the fourth level on to the alternatives at the bottom or fifth level.
At the general criteria level, each of the hierarchies, benefits or costs, involved three major interests. The decision should benefit the recipient, the institution, and society as a whole and their relative importance is the prime determinant as to which outcome is more likely to be preferred. We located these three elements on the second level of the benefits hierarchy. As the decision would benefit each party differently and the importance of the benefits to each recipient affects the outcome, the group thought that it was important to specify the types of benefit for the recipient and the institution. Recipients want physical, psycho-social and economic benefits, while the institution wants only psychosocial and economic benefits. We located these benefits in the third level of the hierarchy. Each of these in turn needed further decomposition into specific items in terms of which the decision alternatives could be evaluated. For example, while the recipient measures economic benefits in terms of reduced costs and improved productivity, the institution needed the more specific measurements of reduced length of stay, better utilization of resources, and increased financial support from the community. There was no reason to decompose the societal benefits into third level subcriteria and hence societal benefits connects directly to the fourth level. The group considered three models for the decision alternatives, and they are at the bottom (or fifth level in this case) of the hierarchy: in Model 1, the hospital provided full care to the patients; in Model 2, the family cares for the patient at home, and the hospital provides only emergency treatment (no nurses go to the house); and in Model 3, the hospital and the home share patient care (with visiting nurses going to the home).
In the costs hierarchy there were also three major interests in the second level that would incur costs or pains: community, institution, and society. In this decision the costs incurred by the patient were not included as a separate factor. Patient and family could be thought of as part of the community. We thought decomposition was necessary only for institutional costs. We included five such costs in the third level: capital costs, operating costs, education costs, bad debt costs, and recruitment costs. Educational costs apply to educating the community and training the staff. Recruitment costs apply to staff and volunteers. Since both the costs hierarchy and the benefits hierarchy concern the same decision, they both have the same alternatives in their bottom levels, even though the costs hierarchy has fewer levels.
The question now is how to use pairwise comparison judgments and derive priorities and synthesize them to obtain the overall benefits and costs of each of the three alternatives, and then again for the costs and combine the two outcomes into a single overall outcome. To do that we need to first explain in simple terms how the process of prioritization is carried out.
A judgment is an expression of an opinion. A comparison is an expression of an opinion about the dominance (importance, preference or likelihood) of one thing over another. Dominance represents the intensity of strength. It is done every day through verbal expression that has some quantitative significance that we need to use to combine the many dominance judgments involved in a decision. The set of all such judgments in making comparisons with respect to a single property or goal can be represented in a square matrix in which the set of elements is compared with itself. It is a way of
organizing all the judgments with respect to that property to be processed and synthesized along with other matrices of comparison judgments involved in that decision. Each judgment represents the dominance of an element in the column on the left of the matrix over an element in the row on top. It reflects the answers to two questions: which of the two elements is more important with respect to a higher level criterion, and how strongly. Let us show how by taking a very simple example of how the mind perceives and prioritizes physical objects that have measurements [5].
Assume that we have three apples A, B, C, and wish to compare them in pairs according to their size. Their sizes are known to be 12 cubic inches, 6 cubic inches and 2 cubic inches respectively. Figure 2.3 shows how the actual numerical relative values are used in comparing an apple on the left with an apple at the top of the matrix.
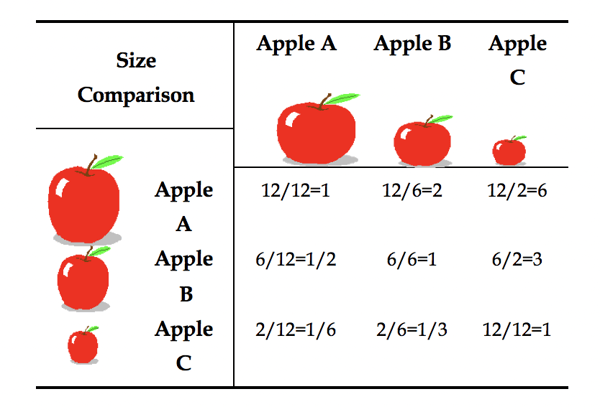
Figure 2.3 Reciprocal Structure of Pairwise Comparison Matrix for Apples
We have the number one on the main diagonal of the matrix, and the values below the diagonal are reciprocals of the corresponding inverse comparison values above the diagonal. Of course it is possible that the apples are not listed in a descending order but we still apply the reciprocal rule. The numbers on the right in each cell tell us how many times an apple on the left dominates an apple at the top with respect to the property of size. If an element on the left is less important than that on the top of the matrix, we enter the reciprocal value in the corresponding position in the matrix. It is important to note that the lesser element is always used as the unit and the greater one is estimated as a multiple of that unit. From all the paired comparisons we calculate the priorities and exhibit them on the right of the matrix. For a set of n elements in a matrix one needs n(n-1)/2 comparisons because there are n 1's on the diagonal for comparing elements with themselves and of the remaining judgments, half are reciprocals. Thus we have (n2-n)/2 judgments. In some problems one may elicit only the minimum of n-1 judgments.
If we do not have the measurements we would have to estimate the relative sizes. The more expert we are the better the estimates. But still our estimates may not fully conform (be consistent) with the values obtained from the ratios of the measurements. Here we used the sizes of the apples which are visible to the eye to make the comparisons, but what if the property is not a physical one how would we make the comparisons and ensure their validity? It is clear that experience and knowledge are necessary to make the comparisons reliable. A child would not be able to make accurate comparisons of the apples. Not only does a decision involve factors that have numbers which need to be interpreted in terms of satisfying our needs, but also involves factors for which there are no measurements that we can only evaluate with our feelings. Whatever meaning and feeling we have, in the end we need to articulate them numerically so we can combine them on the different factors into an outcome. When a decision is complex with conflicting tradeoffs, our minds are usually unable to perform the synthesis of feelings to produce a credible overall outcome. In a group setting we need to combine our feelings and understanding with those of others to arrive at a credible collective outcome.
The first observation is that we can only compare things accurately when they are close or homogeneous, thus it is enough to have a numerical scale that is within this acceptable range but can be extended when we need to in some way that maintains its credibility. We can use scientific knowledge from psycho-physics to develop the numbers used in the comparison scale. This we will do in Chapter 5. We will now show how the fundamental scale of absolute numbers in Table 1.1 is used in our hospice example, a complex decision with several people involved. Its use in this example involves consensus. More satisfying uses of this scale with reciprocal values will be discussed and used in some examples later that involve not only different judgments by different people, but also including the priority of importance of the people themselves. We note that in making pairwise comparisons it is often easier to get people to reach agreement because it is very specific response to a well defined question of dominance.
If we apply this scale directly to the comparisons of the apples and derive the priorities on the right in Figure 2.4 from any column by dividing an entry by the total of the column.
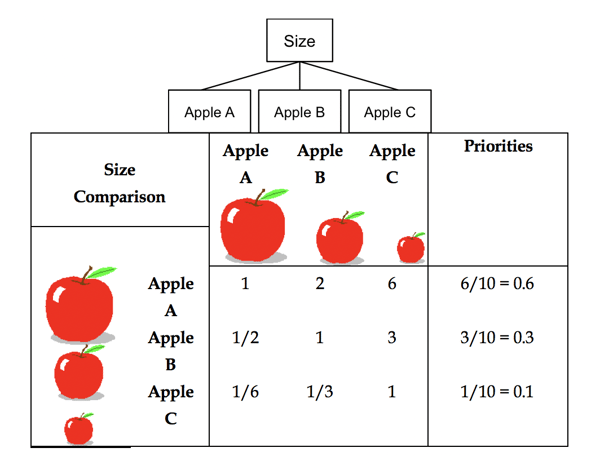
Figure 2.4 Pairwise Comparison Matrix for Apples Using Judgments
Using the columns or adding each row and dividing by the total to derive the priorities is what we do when the matrix is consistent which means for example that since apple A is twice larger than B and six times larger than C, then apple B must be three times larger than C . When that is not the case because judgments can never be so perfect, if the inconsistency is not too large, one can obtain the priorities by performing operations on this matrix (raising it to large enough power and then adding each row elements and dividing by the total). The inconsistency of the matrix can be measured and which comparison value causes the greatest inconsistency can be modified by examining the thinking involved to determine by how much one is willing to change it and so on to the next most inconsistent judgment. If the inconsistency is high and one is unable or unwilling to change the judgments, particularly on the important criteria, one cannot make a decision.
Here are two examples of a different kind to show that this scale, despite its transparent simplicity, gives back known answers rather accurately. There are enough such examples and more complicated ones that would fill a book.
Table 2.1 shows how an audience of about 30 people, using consensus to arrive at each judgment, provided judgments to estimate the dominance of the consumption of drinks in the United States (which drink is consumed more in the US and how much more than another drink?). The derived vector of relative consumption and the actual vector, obtained by normalizing the consumption given in official statistical data sources, are at the bottom of the table.
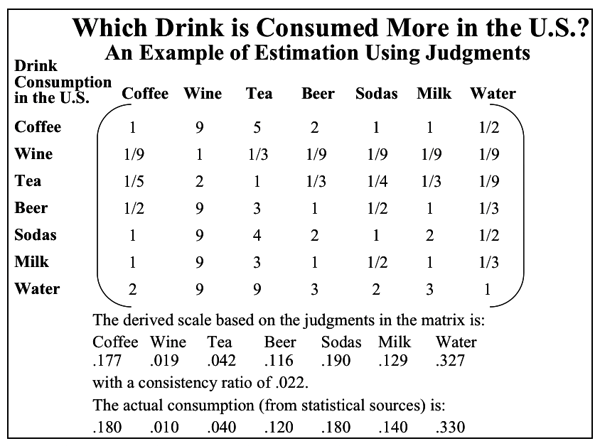
Table 2.1 Relative Consumption of Drinks
Very early in the history of the subject, T.L. Saaty and M. Khouja did the following exercise on an airplane in 1973. They simply used their common knowledge about the relative influence and standing of these countries in the world and without referring to any specific economic data related to GNP values. The two results are close and demonstrate that the general understanding an interested person has about a problem can be used to advantage to make fairly good estimates through paired comparisons [6].
Table 2.2 gives the judgments using the AHP 1-9 scale and Table 2.3 provides the derived priorities, the actual and relative GNP values.
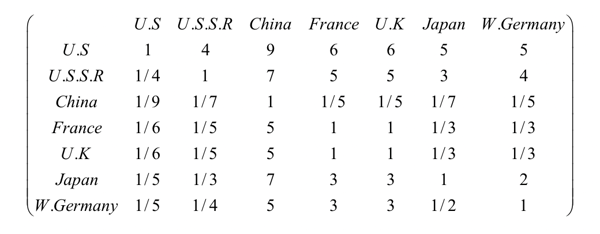
Table 2.2 Paired Comparisons of the Relative Dominance in wealth of Seven Nations
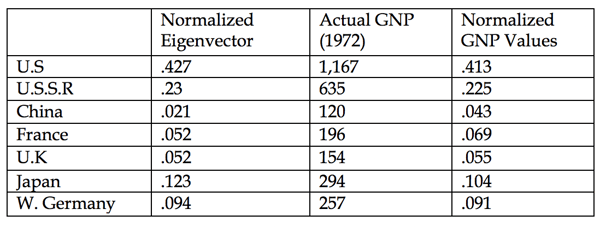
Table 2.3 Outcome of Estimated Relative Wealth and the Actual and Relative Values
As usual with the AHP, in both the cost and the benefits models, we compared the criteria and subcriteria according to their relative importance with respect to the parent element in the adjacent upper level. For example, the entries in the matrix shown in Table 2.4 are responses to the question: which general criterion is more important with respect to choosing the best hospice alternative and how strongly? Here recipient benefits are moderately more important than institutional benefits and are assigned the absolute number 3 in the (1,2) or first-row second-column position. Three signifies three times more. The reciprocal value is automatically entered in the (2,1) position, where institutional benefits on the left are compared with recipient benefits at the top. Similarly a 5, corresponding to strong dominance or importance, is assigned to recipient benefits over social benefits in the (1,3) position, and a 3, corresponding to moderate dominance, is assigned to institutional benefits over social benefits in the (2,3) position with corresponding reciprocals in the transpose positions of the matrix.
Judgments in a matrix may not be consistent. In eliciting judgments, one makes redundant comparisons to improve the validity of the answer, given that respondents may be uncertain or may make poor judgments in comparing some of the elements. Redundancy gives rise to multiple comparisons of an element with other elements and hence to numerical inconsistencies.
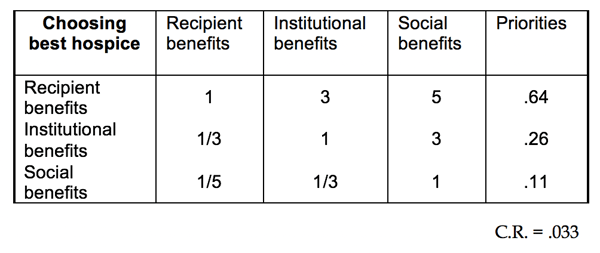
Table 2.4 Judgment Matrix for the Criteria of the Benefits Hierarchy
For example, where we compare recipient benefits with institutional benefits and with societal benefits, we have the respective judgments 3 and 5. Now if x = 3y and x = 5z then 3y = 5z or y = 5/3 z. If the judges were consistent, institutional benefits would be assigned the value 5/3 instead of the 3 given in the matrix. Thus the judgments are inconsistent. In fact, we are not sure which judgments are the accurate ones and which are the cause of the inconsistency. Inconsistency is measured by the inconsistency ratio (C.R.) that compares the inconsistency of the set of judgments in that matrix with what it would be if the judgments and the corresponding reciprocals were taken at random from the scale. For a 3-by-3 matrix this ratio should be about five percent, for a 4-by-4 about eight percent, and for larger matrices, about 10 percent. Inconsistency is inherent in the judgment process. Inconsistency may be considered a tolerable error in measurement only when it is of a lower order of magnitude (10 percent) than the actual measurement itself; otherwise the inconsistency would bias the result by a sizable error comparable to or exceeding the actual measurement itself. These ideas will be further explained in detail in Chapter 5.
When the judgments are inconsistent, the decision-maker may not know where the greatest inconsistency is. The AHP can show one by one in sequential order which judgments are the most inconsistent, and that suggests the value that best improves consistency. However, this recommendation may not necessarily lead to a more accurate set of priorities that correspond to some underlying preference of the decision-makers. Greater consistency does not imply greater accuracy and one should go about improving consistency (if one can, given the available knowledge) by making slight changes compatible with one's understanding. If one cannot reach an acceptable level of consistency, one should gather more information or reexamine the framework of the hierarchy.
Priorities are numerical ranks measured on an absolute scale. The reader will remember that absolute numbers cannot be changed to other numbers and mean the same thing by forming ratios as one does by using a yard or a meter for two readings of the same measurement. An absolute scale cannot have more than one set of readings. The object of evaluation is to elicit judgments concerning relative importance of the elements of the hierarchy to create scales of priority of influence.
To derive the answer we divide the benefits priority of each alternative by its costs priority. We then choose the alternative with the largest of these ratios. It is also possible to allocate a resource proportionately among the alternatives. There is another way to synthesize benefits and costs by weighting their relative importance with respect to strategic criteria and use these weights to synthesize the alternatives by subtracting the weighted costs from the weighted benefits. This will be illustrated in other examples later on.
We will explain how priorities are developed from judgments and how they are synthesized down the hierarchy by a process of weighting and adding. Judgments are used to derive local priorities for a set of nodes (alternatives, say) with respect to a single criterion. Global priorities are obtained by multiplying these local priorities by priority of the criterion. The overall priorities for an element (an alternative) are obtained by adding its global priorities throughout the model. The local priorities are listed on the right of each matrix. Repeating what was said before, if the judgments are perfectly consistent, that is, the inconsistency ratio equals zero, we can obtain the local priorities by adding the values in each row and dividing by the sum of all the judgments in the entire matrix, or by normalizing the judgments in any column by dividing each entry by the sum of the entries in that column. If the judgments are inconsistent but have a tolerable level of inconsistency, we obtain the priorities by raising the matrix to large powers, which is known to take into consideration all intransitivities between the elements, such as those we showed above between x, y, and z. Again, we obtain the priorities from this matrix by adding the judgment values in each row and dividing by the sum of all the judgments. To summarize, the global priorities at the level immediately under the goal are equal to the local priorities because the priority of the goal is equal to one. The global priorities at the next level are obtained by weighting the local priorities of this level by the global priority at the level immediately above and so on. The overall priorities of the alternatives are obtained by weighting the local priorities by the global priorities of all the parent criteria or subcriteria in terms of which they are compared and then adding. (If an element in a set is not comparable with the others on some property and should be left out, the local priorities can be augmented by adding a zero in the appropriate position.)
The process is repeated in all the matrices by asking the appropriate dominance or importance question. For example, the entries in the judgment matrix shown in Table 2.5 are responses to the question: which subcriterion yields the greater benefit with respect to institutional benefits and how strongly?
Here psycho-social benefits are regarded as very strongly more important than economic benefits, and 7 is entered in the (1, 2) position and 1/7 in the (2,1) position.
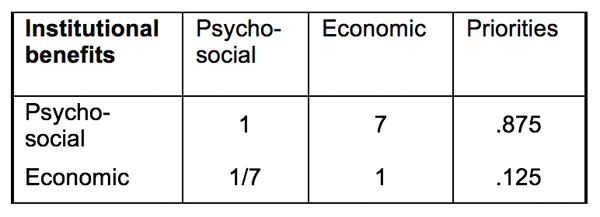
Table 2.5 Judgment Matrix of Subcriteria with Respect to Institutional Benefits
In comparing the three models for patient care, we asked members of the planning association which model they preferred with respect to each of the covering or parent secondary criterion in level 3 or with respect to the tertiary criteria in level 4. For example, for the subcriterion direct care (located on the left-most branch in the benefits hierarchy), we obtained a matrix of paired comparisons in Table 2.6 in which Model 1 is preferred over Models 2 and 3 by 5 and 3 respectively and Model 3 is preferred by 3 over Model 2. The group first made all the comparisons using semantic terms for the fundamental scale and then translated them to the corresponding numbers.
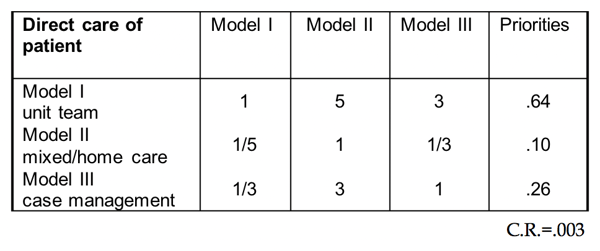
Table 2.6 Relative Benefits of the Models with Respect to Direct Care of Patients
For the costs hierarchy, we again illustrate with three matrices. First the group compared the three major cost criteria and provided judgments in response to the question: which criterion is a more important determinant of the cost of a hospice model? Table 2.7 shows the judgments obtained.
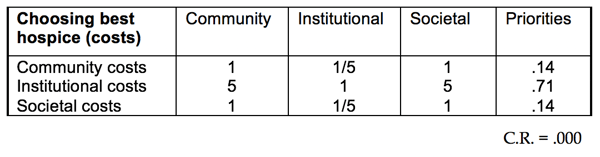
Table 2.7 Judgment Matrix for the Criteria of the Costs Hierarchy
The group then compared the subcriteria under institutional costs and obtained the importance matrix shown in Table 2.8. The entries are responses to the question: which criterion incurs greater institutional costs and how strongly?
Finally we compared the three models to find out which incurs the highest cost for each criterion or subcriterion. Table 2.9 shows the results of comparing them with respect to the costs of recruiting staff.
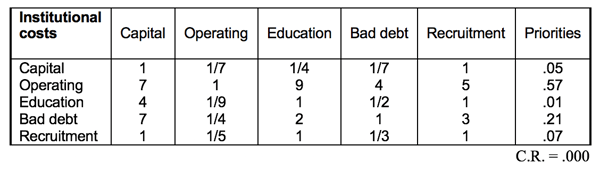
Table 2.8 Judgment Matrix of Subcriteria Under Institutional Costs
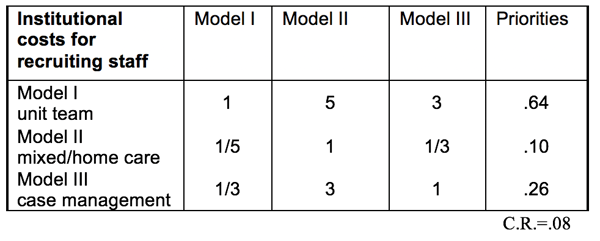
Table 2.9 Relative Costs of the Models with Respect to Recruiting Staff
As shown in Table 2.10, we divided the benefits priorities by the costs priorities for each alternative to obtain the best alternative, model 3, the one with the largest value for the ratio.
Table 2.10 shows two ways or modes of synthesizing the local priorities of the alternatives using the global priorities of their parent criteria: The distributive mode and the ideal mode. In the distributive mode, the weights of the alternatives sum to one. It is used when there is dependence among the alternatives and a unit priority is distributed among them. The ideal mode is used to obtain the single best alternative regardless of what other alternatives there are. In the ideal mode, the local priorities of the alternatives are divided by the largest value among them. This is done for each criterion; for each criterion one alternative becomes an ideal with value one. In both modes, the local priorities are weighted by the global priorities of the parent criteria and synthesized and the benefit-to-cost ratios formed. In this case, both modes lead to the same outcome for hospice, which is model 3. As we shall see below, we need both modes to deal with the effect of adding (or deleting) alternatives on an already ranked set.
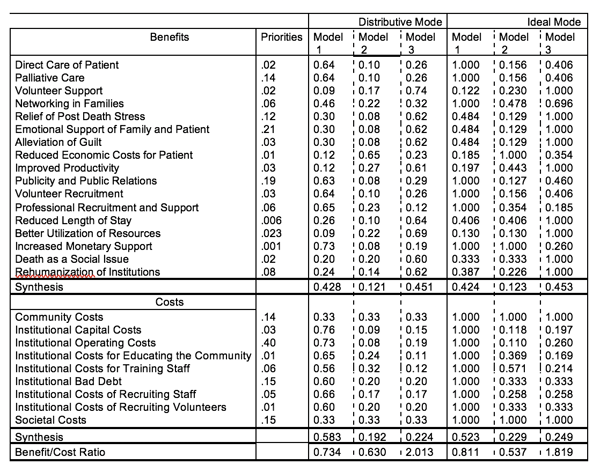
Table 2.10 Global and Ideal Modes of Synthesizing the Local Priorities of the Alternatives
Model 3 has the largest ratio of benefits to costs in both the distributive and ideal modes, and the hospital selected it for treating terminal patients. This need not always be the case. In this case, there is dependence of the personnel resources allocated to the three models because some of these resources would be shifted based on the decision. Therefore the distributive mode is the appropriate method of synthesis. If the alternatives were sufficiently distinct with no dependence in their definition, the ideal mode would be the way to synthesize.
We also performed marginal analysis to determine where the hospital should allocate additional resources for the greatest marginal return. To perform marginal analysis, we first ordered the alternatives by increasing cost priorities and then formed the benefit-to-cost ratios corresponding to the smallest cost, followed by the ratios of the differences of successive benefits to costs. If this difference in benefits is negative, the new alternative is dropped from consideration and the process continued. The alternative with the largest marginal ratio is then chosen. For the costs and corresponding benefits from the synthesis rows in Table 2.10 we obtained:
Costs: .20 .21 .59
Benefits: .12 .45 .43
From these values we compute the marginal ratios as the final priorities: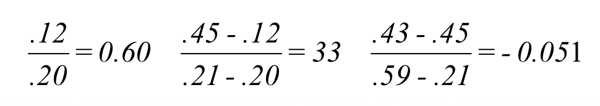 The third alternative is not a contender for resources because its marginal return is negative. The second alternative is best. In fact, in addition to adopting the third model, the hospital management chose the second model of hospice care for further development.
People are able to make two kinds of comparisons - absolute and relative. In absolute comparisons, people compare alternatives with a standard in their memory that they have developed through experience. In relative comparisons, they compared alternatives in pairs according to a common attribute, as we did throughout the hospice example.
People use absolute measurement (sometimes also called rating) to rank independent alternatives one at a time in terms of rating intensities for each of the criteria. An intensity is a range of variation of a criterion that enables one to distinguish the quality of an alternative for that criterion. An intensity may be expressed as a numerical range of values if the criterion is measurable or defined in qualitative terms.
For example, if ranking students is the objective and one of the criteria on which they are to be ranked is performance in mathematics, the mathematics ratings might be: excellent, good, average, below average, poor; or, using the usual school terminology, A, B, C, D, and F. Relative comparisons are first used to set priorities on the ratings themselves. If desired, one can fit a continuous curve through the derived intensities. This concept may go against our socialization. However, it is perfectly reasonable to ask how much an A is preferred to a B or to a C. The judgment of how much an A is preferred to a B might be different under different criteria. Perhaps for mathematics an A is very strongly preferred to a B, while for physical education an A is only moderately preferred to a B. So the end result might be that the ratings are scaled differently. For example one could have the scale values for the ratings as shown in Table 2.11:
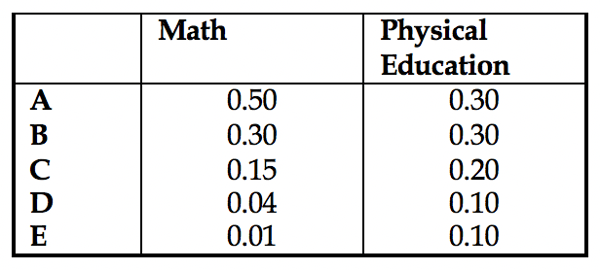
Table 2.11 Examples of Scale Values for Ratings
The alternatives are then rated or ticked off one at a time using the intensities. We will illustrate absolute measurement with an example. A firm evaluates its employees for raises. The criteria are dependability, education, experience, and quality. Each criterion is subdivided into intensities, standards, or subcriteria (Figure 2.5). The managers set priorities for the criteria by comparing them in pairs. They then pairwise compare the intensities according to priority with respect to their parent criterion (as in Table 2.12) or with respect to a subcriterion if they are using a deeper hierarchy. The priorities of the intensities are divided by the largest intensity for each criterion (second column of priorities in Figure 2.5). 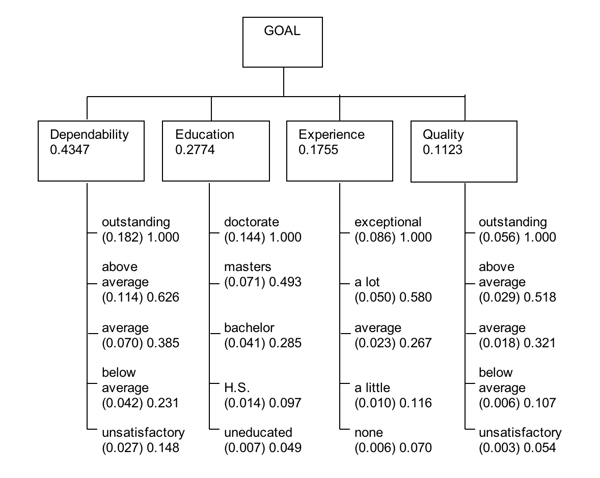
Figure 2.5 Hierarchy with Absolute Measurement
Table 2.12 shows a paired comparison matrix of intensities with respect to dependability. The managers answer the question: which intensity is more important and by how much with respect to dependability. The priorities of the intensities for each criterion are divided by the largest one and multiplied by the priority of the criterion. Finally the managers rate each individual (Table 2.13) by assigning the intensity rating that applies to him or her under each criterion. The scores of these intensities are each weighted by the priority of its criterion and summed to derive a total ratio scale score for the individual (shown on the right of Table 2.13). These numbers belong to an absolute scale, and the managers can give salary increases precisely in proportion to the ratios of these numbers. Adams gets the highest score and Kesselman the lowest. This approach can be used whenever it is possible to set priorities for intensities of criteria; people can usually do this when they have sufficient experience with a given operation. This normative mode requires that alternatives be rated one by one without regard to how many there may be and how high or low any of them rates on prior standards. Some corporations have insisted that they no longer trust the normative standards of their experts and that they prefer to make paired comparisons of their alternatives. Still, when there is wide agreement on standards, the absolute mode saves time in rating a large number of alternatives.
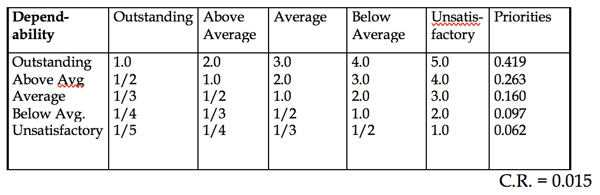
Table 2.12 Ranking Intensities: Which intensity is preferred most with respect to dependability and how strongly?
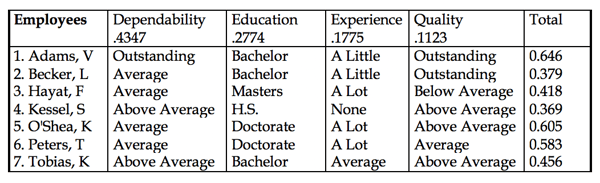
Table 2.13 Rating Alternatives
Think of the following situation: we need to determine the relative size of a blueberry and a watermelon. Here, we need a range greater than 1-9. Human beings have difficulty establishing appropriate relationships when the ratios get beyond 9. To resolve this human difficulty, we can use a method in which we cluster different elements so we can rate them within a cluster and then rate them across the clusters. We need to add other fruits to make the comparison possible and then form groups of comparable fruits. In the first group we include the blueberry, a grape, and a plum. In the second group we include the same plum, an apple, and a grapefruit. In the third group we include the same grapefruit, a melon, and the watermelon. The AHP requires reciprocal comparisons of homogeneous elements whose ratios do not differ by much on a property, hence the absolute scale ranges from one to nine. When the ratios are larger, one must cluster the elements in different groups and use a common element (pivot) that is the largest in one cluster and the smallest element in the next cluster of the next higher order of magnitude. The weights of the elements in the second group are divided by the priority of the pivot in that group and then multiplied by the priority of the same pivot element (whose value is generally different) from the first group, making them comparable with the first group. The process is then continued. The reason for using clusters of a few elements is to ensure greater stability of the priorities in face of inconsistent judgments. Comparing more than two elements allows for redundancy and hence also for greater validity of real-world information. The AHP often uses seven elements and puts them in clusters if there are more than seven. (Elaborate mathematical derivations are given in the AHP to show that the number of elements compared should not be too large in order to obtain priorities with admissible consistency.)
At this point you may wonder why we have three different modes for establishing priorities, the absolute measurement mode and the distributive and ideal modes of relative measurement. Isn't one enough? Let us explain why we need more than one mode.
A major reason for having more than one mode is concerned with this question. What happens to the synthesized ranks of alternatives when new ones are added or old ones deleted? With consistent judgments, the original relative rank order cannot change under any single criterion, but it can under several criteria.
Assume that an individual has expressed preference among a set of alternatives, and that as a result, he or she has developed a ranking for them. Can and should that individual's preferences and the resulting rank order of the alternatives be affected if alternatives are added to the set or deleted from it and if no criteria are added or deleted? What if the added alternatives are copies or near copies of one or of several of the original alternatives and their number is large? Rank reversal is an unpleasant property if it is caused by the addition of truly irrelevant alternatives [7, 8]. However, the addition of alternatives may just reflect human nature: the straw that broke the camel's back was considered irrelevant along with all those that went before it. Mathematically, the number and quality of newly added alternatives are known to affect preference among the original alternatives.
Most people, unaided by theory and computation, make each decision separately, and they are not very concerned with rank reversal unless they are forced for some reason to refer to their earlier conclusions. We think it is essential to understand and deal with this phenomenon.
Two products A and B are evaluated according to two equally important attributes P and Q as in the matrices in
Table 2.14 below:
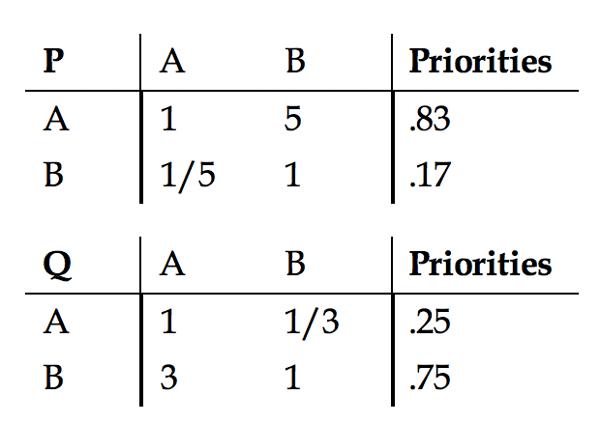
Table 2.14 Preference Matrices of Products A and B with Respect to Equally Important Attributes P and Q
We obtain the following priorities: WA = .542, WB = .458, and A is preferred to B.
A third product C is then introduced and compared with A and B as shown in Table 2.15:
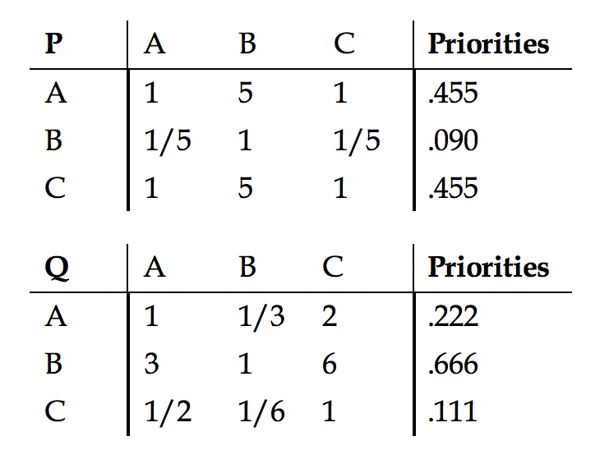
Table 2.15 Preference Matrices with Product C Added
Synthesis yields WA = .338, WB = .379, and WC = .283. Here B is preferred to A and there is rank reversal.
For a decision theory to have a lasting value, it must consider how people make decisions naturally and assist them in organizing their thinking to improve their decisions in that natural direction. Its assumptions should be tied to evolution and not to present day determinism. This is the fundamental concept on which the AHP is based. It was developed as a result of a decade of unsuccessful attempts to use normative theories, with the assistance of some of the world's best minds, to deal with negotiation and trade-off in the strategic political and diplomatic arena at the Arms Control and Disarmament Agency in the Department of State. In the early 1970s, the first author asked the question, how do ordinary people process information in their minds in attempting to make a decision and how do they express the strength of their judgments? The answer to this question led to considering hierarchies and networks, paired comparisons, absolute scales, homogeneity and consistency, priorities, ranking, and the AHP.
R. Corbin and A. Marley [9] provide a utility theory example of rank reversal. It "concerns a lady in a small town, who wishes to buy a hat. She enters the only hat store in town, and finds two hats, A and B, that she likes equally well, and so might be considered equally likely to buy. However, now suppose that the sales clerk discovers a third hat, C, identical to B. Then the lady may well choose hat A for sure (rather than risk the possibility of seeing someone wearing a hat just like hers), a result that contradicts regularity." Utility theory has no clear analytical answer to this paradox or to famous examples having to do with phantom alternatives and with decoy alternatives that arise in the field of marketing [10].
Because of such examples, it is clear that one cannot simply use one procedure for every decision problem because that procedure would either preserve or not preserve rank. Nor can one introduce new criteria that indicate the dependence of the alternatives on information from each new alternative that is added. In the AHP, this issue has been resolved by adding the ideal mode to the normalization mode in relative measurement. The ideal mode presents an alternative that is rated low or "irrelevant" on all the criteria from affecting the rank of higher rated alternatives.
In the AHP, we have one way to allow rank to change, and two ways to preserve rank.
As a recap, in relative measurement, we use normalization by dividing by the sum of the priorities of the alternatives to define the distributive mode. In this mode, we distribute the unit value assigned to the goal of a decision proportionately among the alternatives through normalization. When we add a new alternative, it takes its share of the unit from the previously existing alternatives. This mode allows for rank reversal because dependence exists among the alternatives, which is attributable to the number of alternatives and to their measurements values and which is accounted for through normalization. For example, multiple copies of an alternative can affect preference for that alternative in some decisions. We need to account for such dependence in allocating resources, in voting and in distributing resources among the alternatives.
We conducted an experiment with our colleague L. G. Vargas involving 64,000 hierarchies with priorities assigned randomly to criteria and to alternatives to test the number of times the best choice obtained by the distributive and ideal modes coincided with each other. It turns out that the two methods yield the same top alternative 92 percent of the time. We obtained similar results for the top two alternatives [11].
The essence of the AHP is the use of absolute scales in elaborate structures to assess complex problems. An absolute scale uses numbers that can’t be changed. For example in physics one uses a ratio scale to measure weight in pounds (P) or kilograms (K) approximately related by the formula or length with inches and with centimeters related by another ratio scale formula centimeters = 2.54 inches. In both formulas the ratio of the weight of two objects measured in pounds or measured in kilograms is the same and similarly for lenghts. Temperature is measured with a Fahrenheit scale (F) and a Celsius scale C, related by the formula known as an interval scale. Absolute scale numbers can’t be measured with different scales. For example if we compare two apples according to size and determine that one apple is three times larger than another, we can’t change the number three to another number by another scale to obtain a meaningful number. Here the number three is an absolute number. In decision making we use absolute numbers whose magnitudes are always the same. The AHP well fits the words of Thomas Paine in his Common Sense, "The more simple anything is, the less liable it is to be disordered and the easier repaired when disordered."
The AHP makes group decision-making possible by aggregating judgments in a way that satisfies the reciprocal relation in comparing two elements. When the group consists of experts, each works out his or her own hierarchy and the AHP combines the outcomes using the geometric mean of the judgments. If the experts are ranked according to their expertise in a separate hierarchy, we can raise their individual evaluations to the power of their importance or expertise priorities before taking the geometric mean. We have also used special questionnaires to gather data in the AHP.
Practitioners have developed multicriteria decision approaches largely around techniques for generating scales for alternatives. But we believe that making decisions in real life situations depends on the depth and sophistication of the structures decision makers use to represent a decision or prediction problem rather than simply on manipulations - although they are also important. Decision making and prediction must go hand-in-hand if a decision is to survive the test of the forces it may encounter. If one understands the lasting value of a best decision, one will want to consider feedback structures with possible dependencies among all the elements. These would require iterations with feedback to determine the best outcome and the most likely to survive. We believe that ratio scales are mathematically compelling for this process. The AHP is increasingly used for decisions with interdependencies (the hierarchic examples we have described are simple special cases of such decisions). We describe applications of feedback later in the book.
Many good decision-makers do not rely on a theory to make their decisions. Are their good decisions accidental, or are there implicit logical principles that guide the mind in the process of making a decision, and are these principles complete and consistent? We believe that there are such principles, and that in thoughtful people, they work as formalized and described in the analytic hierarchy process. Still academics differ about how people should and should not make decisions. Experiments with people have shown that what people do differs from the theoretical and normative considerations the experts consider important. This may lead one to believe that analytical decision making is of little value. But our experience and that of many others indicate the opposite.
Analytic decision making is of tremendous value, but it must be simple and accessible to the lay user, and must have scientific justification of the highest order. Here are a few ideas about the benefits of the descriptive analytical approach. First is the morphological way of thoroughly modeling the decision, inducing people to make explicit their tacit knowledge. This leads people to organize and harmonize their different feelings and understanding. An agreed upon structure provides ground for a complete multisided debate. Second, particularly in the framework of hierarchies and feedback systems, the process permits decision makers to use judgments and observations to surmise relations and strengths of relations in the flow of interacting forces moving from the general to the particular and to make predictions of most likely outcomes. Third, people are able to incorporate and trade off values and influences with greater accuracy of understanding than they can by using language alone. Fourth, people are able to include judgments that result from intuition and emotion as well those that result from logic. Reasoning takes a long time to learn, and it is not a skill common to all people. By representing the strength of judgments numerically and agreeing on a value, decision-making groups do not need to participate in a prolonged argument. Finally, a formal approach allows people to make gradual and more thorough revisions and to combine the conclusions of different people studying the same problem in different places. One can also use such an approach to piece together partial analyses of the components of a bigger problem, or to decompose a larger problem into its constituent parts. This is an exhaustive list of the uses of the AHP. To deal with complexity we need rationality, and that is best manifested in the analytical approach.
Hershey, J.C. and Schoemaker, P.J.H. “Prospect Theory's Reflection Hypothesis: A Critical Examination.” Organization of Behavioral Human Performances. 25 (1980): No. 3, pp. 395-418.
Luce, R.D. and Raiffa, H., Games and Decisions. New York: John Wiley and Sons, 1957.